Child poverty rates by local authority
Child poverty rates by parliamentary constituency
Percentage of children affected by the two-child limit
Child poverty rates by ward
Greater Manchester
Merseyside & Cheshire
Lancashire & Cumbria
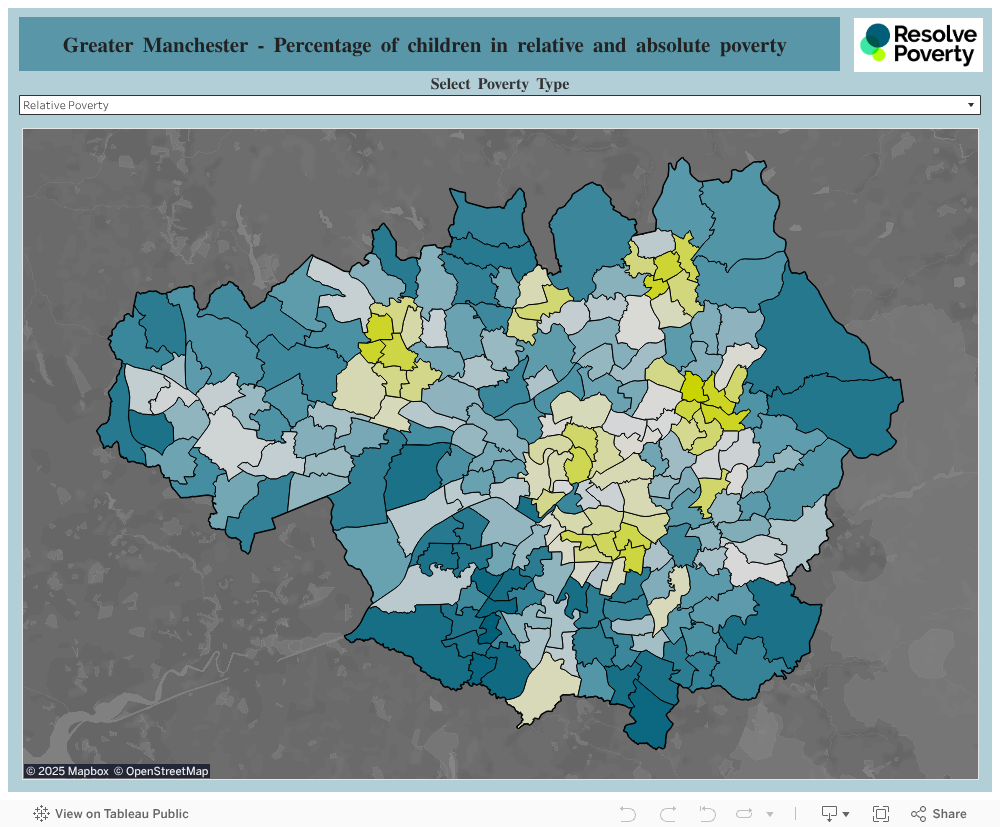
Greater Manchester
This map shows Resolve Poverty estimates of the percentage of children living in relative poverty and absolute poverty (before housing costs) in each electoral ward in Greater Manchester in 2023 (the most recent data available).
Please note that the data available is for wards that may have changed or that no longer exist following boundary reviews in a number of areas.
Because this data shows poverty rates before housing costs, the figures are not comparable with the after housing costs local authority and parliamentary level data also shown on this page.
For the total population of each ward, see our population estimates.
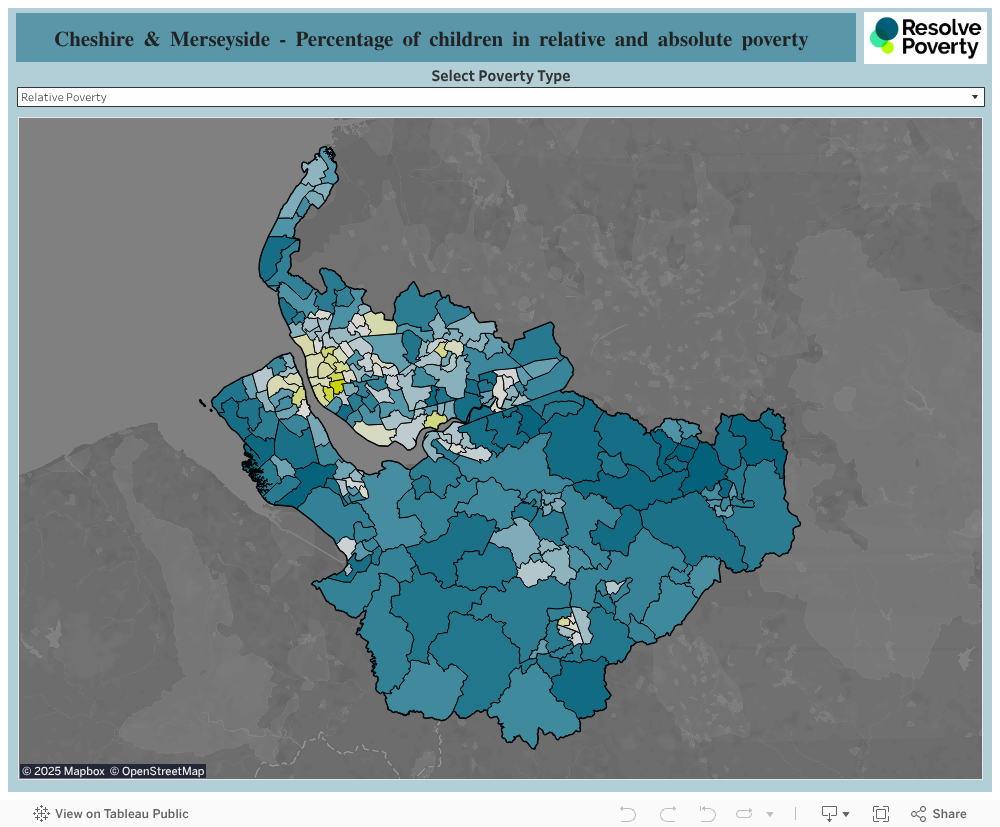
Merseyside & Cheshire
This map shows Resolve Poverty estimates of the percentage of children living in relative poverty and absolute poverty (before housing costs) in each electoral ward in Merseyside and Cheshire in 2023 (the most recent data available).
Please note that the data available is for wards that may have changed or that no longer exist following boundary reviews in a number of areas.
Because this data shows poverty rates before housing costs, the figures are not comparable with the after housing costs local authority and parliamentary level data also shown on this page.
For the total population of each ward, see our population estimates.
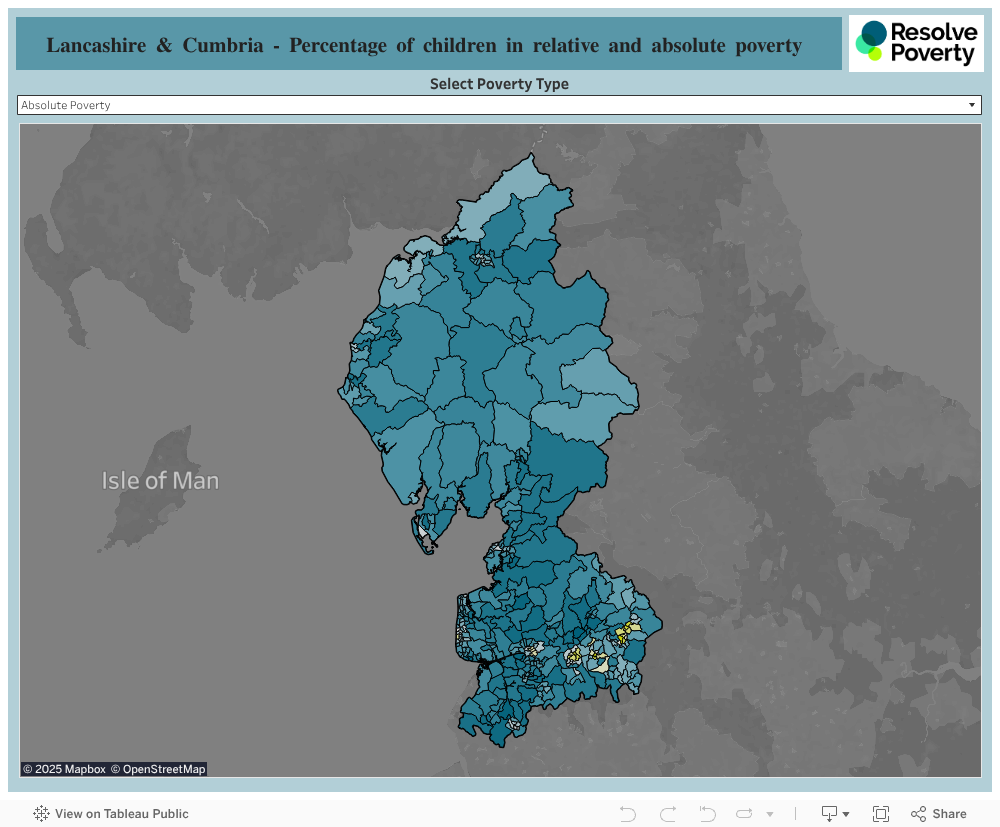
Lancashire & Cumbria
This map shows Resolve Poverty estimates of the percentage of children living in relative poverty and absolute poverty (before housing costs) in each electoral ward in Lancashire and Cumbria in 2023 (the most recent data available).
Please note that the data available is for wards that may have changed or that no longer exist following boundary reviews in a number of areas.
Because this data shows poverty rates before housing costs, the figures are not comparable with the after housing costs local authority and parliamentary level data also shown on this page.
For the total population of each ward, see our population estimates.
Deprivation by ward
Greater Manchester
Merseyside & Cheshire
Lancashire & Cumbria
Greater Manchester
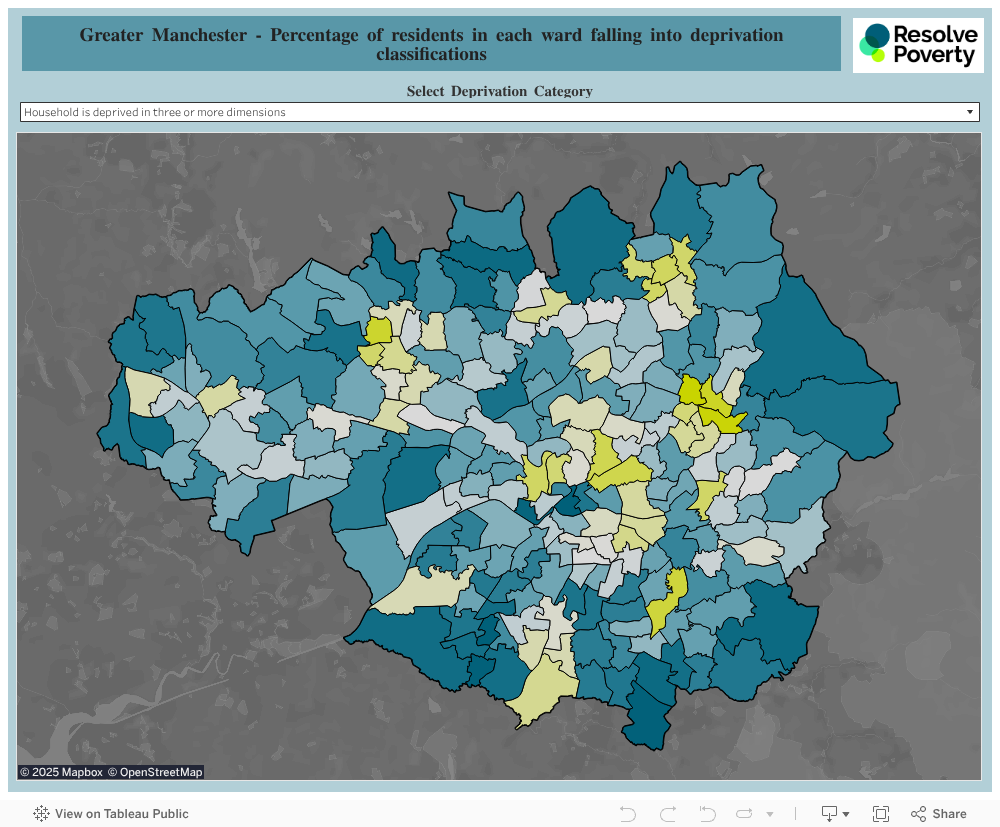
This map shows the percentage of households experiencing multiple aspects of deprivation in 2021 using deprivation dimensions developed by the Office of National Statistics. The figures are based on Census 2021 data. The four deprivation dimensions are employment, education, health and disability, and household overcrowding. Read more about this on the Office for National Statistics website.
Please note that the data available is for wards that may have changed or that no longer exist following boundary reviews in a number of areas.
For the total population of each ward, see our population estimates.
Merseyside & Cheshire
This map shows the percentage of households experiencing multiple aspects of deprivation in 2021 using deprivation dimensions developed by the Office of National Statistics. The figures are based on Census 2021 data. The four deprivation dimensions are employment, education, health and disability, and household overcrowding. Read more about this on the Office for National Statistics website.
Please note that the data available is for wards that may have changed or that no longer exist following boundary reviews in a number of areas.
For the total population of each ward, see our population estimates.

Lancashire & Cumbria
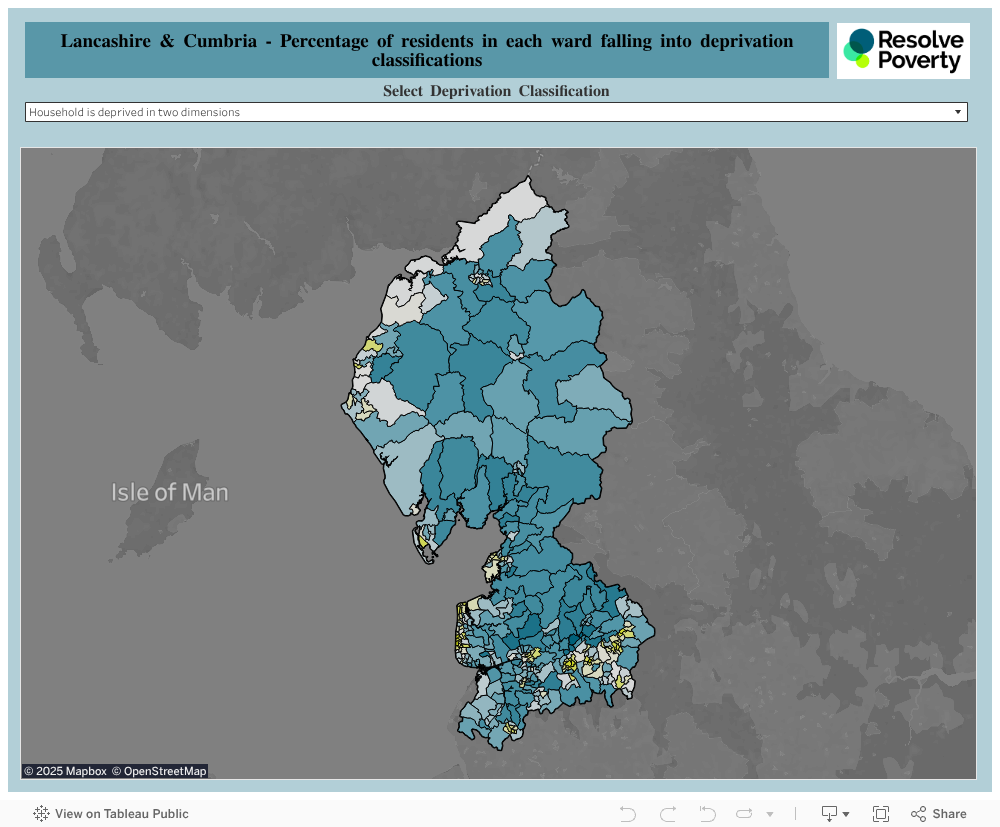
This map shows the percentage of households experiencing multiple aspects of deprivation in 2021 using deprivation dimensions developed by the Office of National Statistics. The figures are based on Census 2021 data. The four deprivation dimensions are employment, education, health and disability, and household overcrowding. Read more about this on the Office for National Statistics website.
Please note that the data available is for wards that may have changed or that no longer exist following boundary reviews in a number of areas.
For the total population of each ward, see our population estimates.
Socio-economic classification by ward
Greater Manchester
Merseyside & Cheshire
Lancashire & Cumbria
Greater Manchester
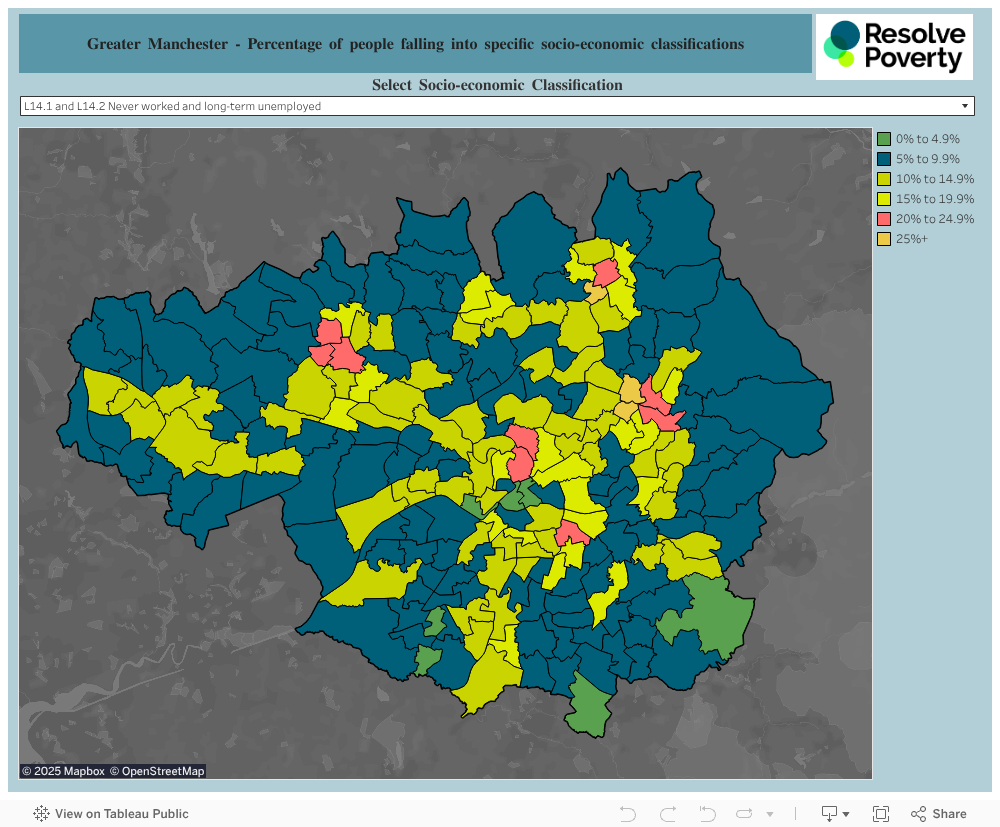
This map shows socio-economic levels by ward using Office for National Statistic Socio-economic Classification (NS-SEC). NS-SEC indicates a person’s socio-economic position based on their occupation and other job characteristics.
In this map we show the proportion of people falling into two NS-SEC groupings:
- L1, L2 and L3: Higher managerial, administrative and professional occupations and L4, L5 and L6: Lower managerial, administrative and professional occupations combined.
- L14.1 and L14.2: Never worked and long-term unemployed.
Read more about the classifications here.
For the total population of each ward, see our population estimates.
Merseyside & Cheshire
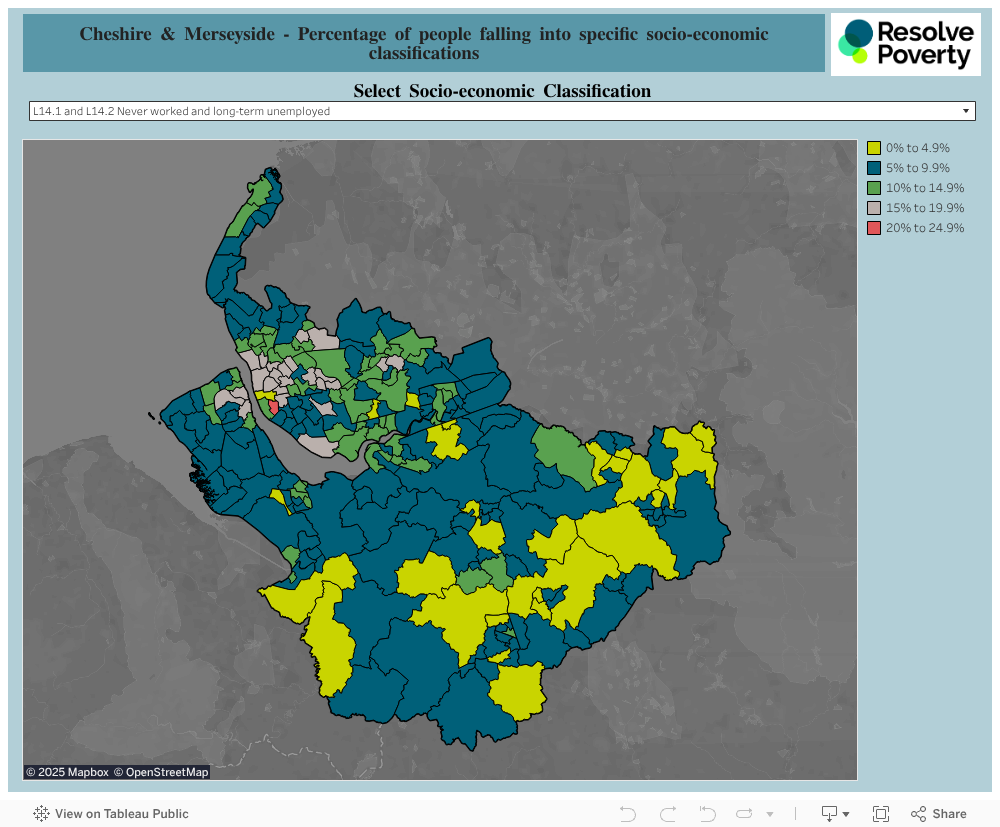
This map shows socio-economic levels by ward using Office for National Statistic Socio-economic Classification (NS-SEC). NS-SEC indicates a person’s socio-economic position based on their occupation and other job characteristics.
In this map we show the proportion of people falling into two NS-SEC groupings:
- L1, L2 and L3: Higher managerial, administrative and professional occupations and L4, L5 and L6: Lower managerial, administrative and professional occupations combined.
- L14.1 and L14.2: Never worked and long-term unemployed.
Read more about the classifications here.
For the total population of each ward, see our population estimates.
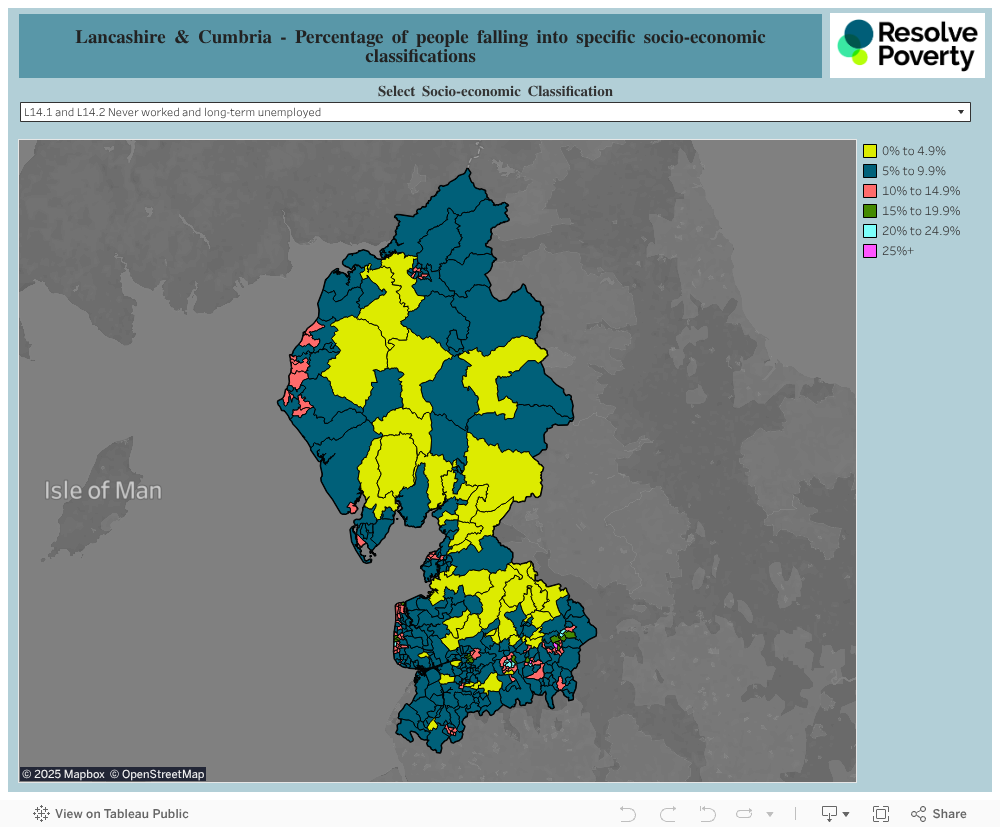
Lancashire & Cumbria
This map shows socio-economic levels by ward using Office for National Statistic Socio-economic Classification (NS-SEC). NS-SEC indicates a person’s socio-economic position based on their occupation and other job characteristics.
In this map we show the proportion of people falling into two NS-SEC groupings:
- L1, L2 and L3: Higher managerial, administrative and professional occupations and L4, L5 and L6: Lower managerial, administrative and professional occupations combined.
- L14.1 and L14.2: Never worked and long-term unemployed.
Read more about the classifications here.
For the total population of each ward, see our population estimates.
Children in poverty who do not qualify for Free School Meals
Life expectancy by ward
Greater Manchester
Merseyside & Cheshire
Lancashire & Cumbria
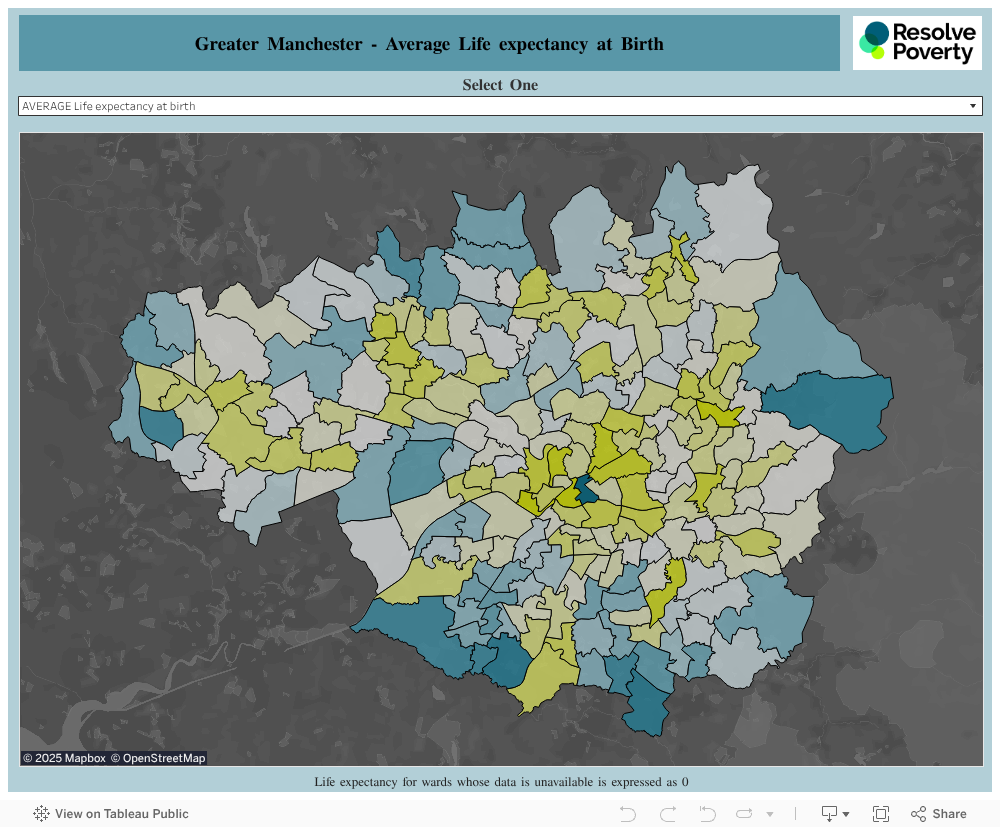
Greater Manchester
Life expectancy tends to be lower for those experiencing poverty and deprivation, and for those living in areas with higher rates of poverty and deprivation. This map shows the average life expectancy at birth for people in each electoral ward in Greater Manchester. The data is from 2021 and is calculated as a four-year average between 2016-2020.
Please note that the latest data available uses 2021 wards. Some may have changed or no longer exist following boundary reviews in several areas.
Use the drop-down menu to see average life expectancy at birth in Greater Manchester for:
- Males
- Females
- Total (males and females).
For the total population of each ward, see our population estimates.
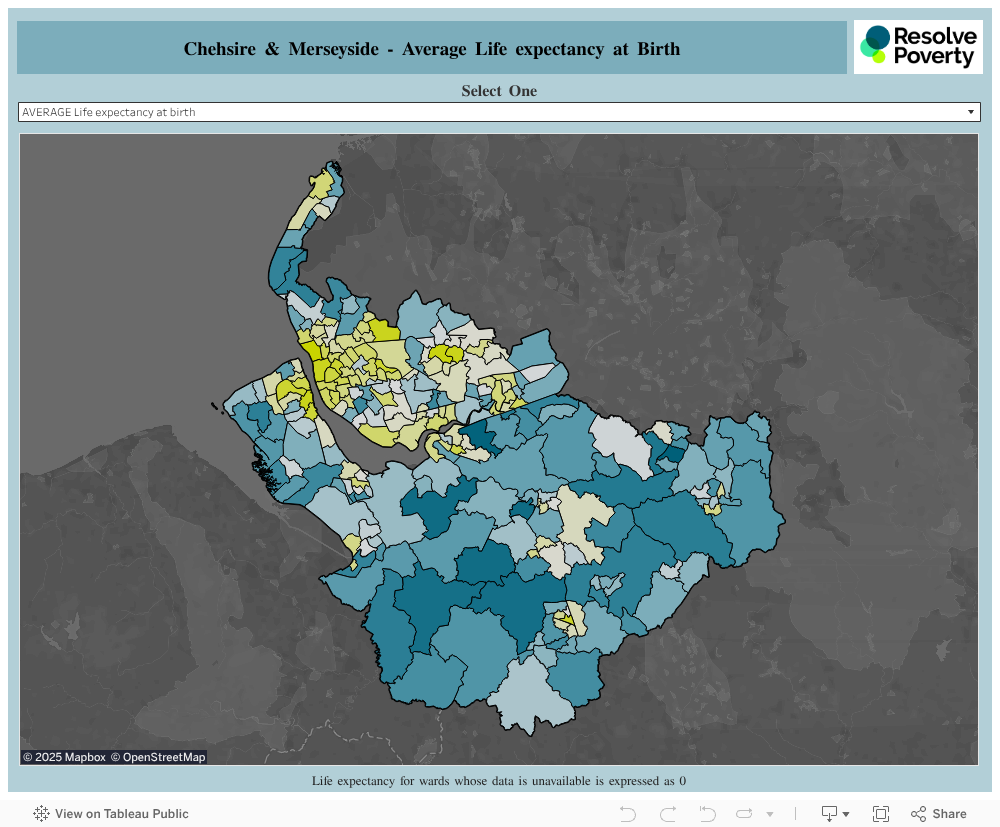
Merseyside & Cheshire
This map shows the average life expectancy at birth for people in each electoral ward in Cheshire and Merseyside. The data is from 2021 and is calculated as a four-year average between 2016-2020.
Please note that the latest data available uses 2021 wards. Some may have changed or no longer exist following boundary reviews in several areas.
Use the drop-down menu to see average life expectancy at birth in Cheshire and Merseyside for:
- Males
- Females
- Total (males and females).
For the total population of each ward, see our population estimates.
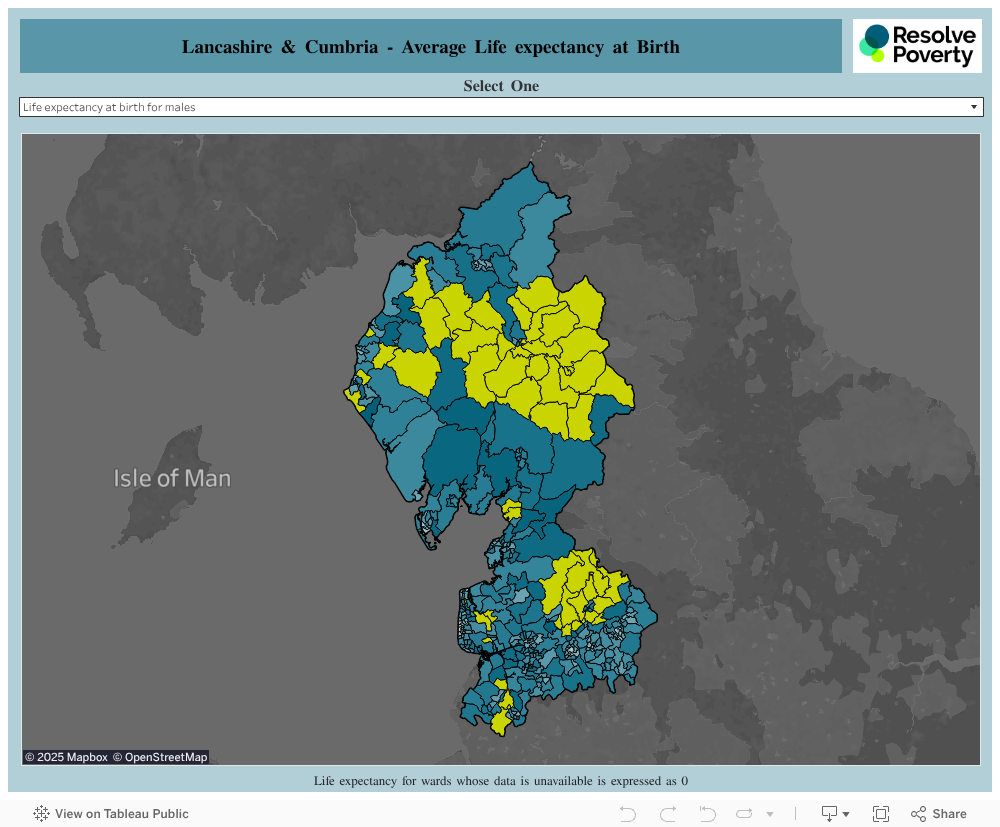
Lancashire & Cumbria
This map shows the average life expectancy at birth for people in each electoral ward in Lancashire and Cumbria. The data is from 2021 and is calculated as a four-year average between 2016-2020.
Please note that the latest data available uses 2021 wards. Some may have changed or no longer exist following boundary reviews in several areas.
Use the drop-down menu to see average life expectancy at birth in Lancashire and Cumbria for:
- Males
- Females
- Total (males and females).
For the total population of each ward, see our population estimates.