Homelessness duties by local authority
Households in temporary accommodation by local authority
Estimated rough sleepers per night by local authority
Claimants of Housing Benefit and the housing element of Universal Credit
Average annual income in comparison to average house price, by local authority
Average monthly income in comparison to average monthly rent, by local authority
Percentage of residents in different household types by ward
Greater Manchester
Merseyside & Cheshire
Lancashire & Cumbria
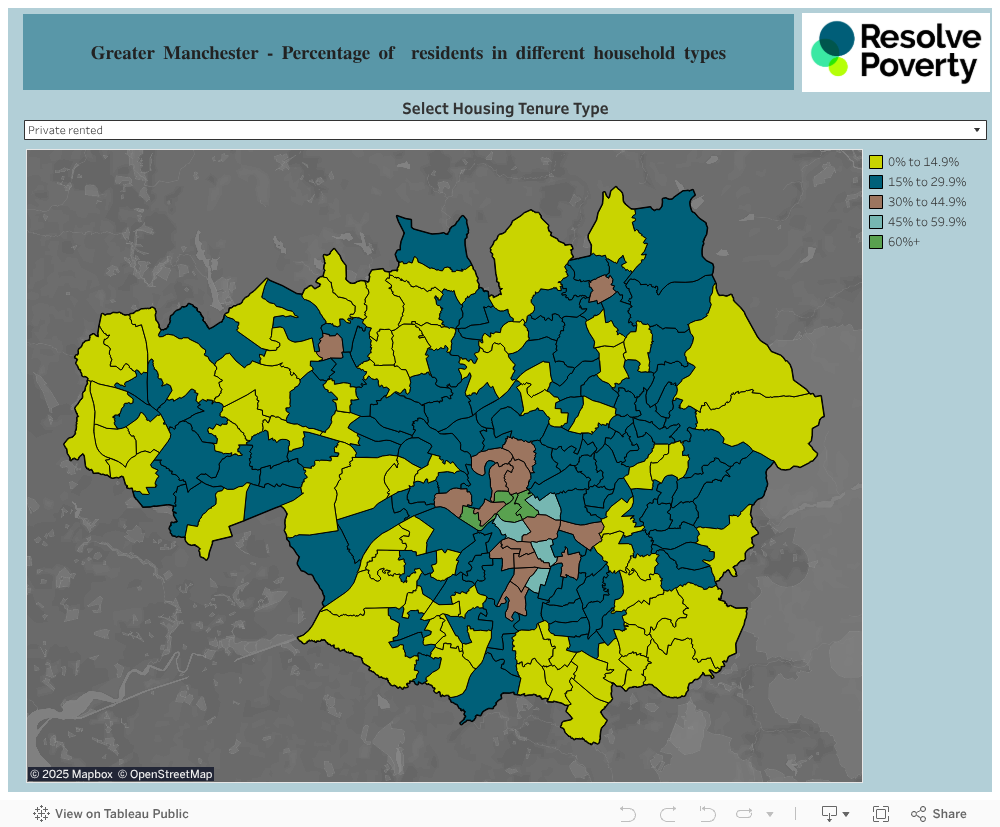
Greater Manchester
This map show the percentage of residents living in different housing tenure types by ward in Greater Manchester, based on Census 2021 data. National poverty data shows us that people living in socially rented and privately rented accommodation are at greater risk of poverty than owner occupiers.
Use the drop down menu to select the housing tenure type you are interested in (Owned – including shared ownership, social rented and private rented).
For the total population of each ward, see our population estimates.
Merseyside & Cheshire
This map show the percentage of residents living in different housing tenure types by ward in Merseyside and Cheshire, based on Census 2021 data. National poverty data shows us that people living in socially rented and privately rented accommodation are at greater risk of poverty than owner occupiers.
Use the drop down menu to select the housing tenure type you are interested in (Owned – including shared ownership, social rented and private rented).
For the total population of each ward, see our population estimates.

Lancashire & Cumbria
This map show the percentage of residents living in different housing tenure types by ward in Lancashire and Cumbria, based on Census 2021 data. National poverty data shows us that people living in socially rented and privately rented accommodation are at greater risk of poverty than owner occupiers.
Use the drop down menu to select the housing tenure type you are interested in (Owned – including shared ownership, social rented and private rented).
For the total population of each ward, see our population estimates.
